
Charting the course for a legacy project with profound impact
[UPDATED as of December 1, 2025] This multi-year proforma begins with a forecasting of costs based on the standards for residential child-care in North Carolina, specifically Chapter 70I for years 1-3 (Phase One). Table 1 (below) summarizes applicable line-item costs from 10A NCAC 70I related to private, non-profit licensing, governance, personnel, admission, program, and residential code requirements for 5 homes. Table 2 summarizes the cost by Year 3 on a per Home and per Child basis. Table 3 features cost forecasts related to Phase Two (2028-2030) with 24-26 girls in-residence, and Phase Three (2031-2035) with 32-36 girls in-residence by 2034 across 8 homes.
TABLE 1: Phase One Cost Forecast (Years 1-3)
 | YR1 2026 | YR 2 2027 | YR 3 2028 | PHASE ONE |
| Programs | $113,250 | $248,250 | $392,100 | $753,600 |
| Home Operations* | $103,000 | $108,550 | $114,050 | $325,600 |
| Administrative | $44,100 | $45,800 | $50,900 | $140,800 |
| Staffing | $167,000 | $300,000 | $376,000 | $843,000 |
| Fundraising | $61,015 | $82,703 | $123,663 | $267,381 |
| Land Acquisition | $670,000 | $670,000 | ||
| Construction | $425,000 | $860,000 | $875,000 | $2,160,000 |
| TOTAL | $1,583,365 | $1,645,303 | $1,931,713 | $5,160,381 |
| LESS Land/Const | $488,365 | $785,303 | $1,056,713 | $2,330,381 |
TABLE 2: Year 3 Operational Costs (by Home & Child)
| DESCRIPTION | # | per Unit Cost | ||
| # of Homes (Year 3) | 5 | $211,343 | /home/yr | |
| # of Girls (Year 3) | 20 | $52,836 | /child/yr | |
| *Home Operations (see Table 1 Line 2) | 5 | $22,810 | /home/yr |
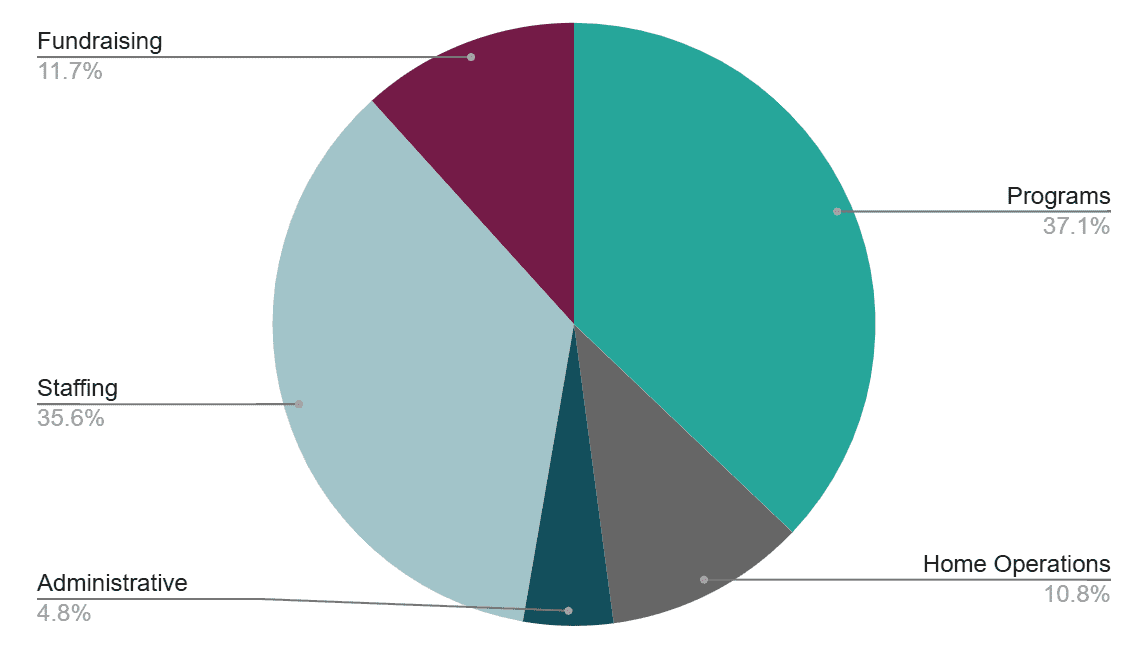
KEY POINTS: At 5 homes (by Year 3), PHIGS’ annual operating budget will be approximately $1.1 million, of which 37% will be for program costs, 11% will be for home operations, 36% will cover management and staffing needs, and 5% will be for office and administrative expenses. Our objective is to constrain fundraising costs to be under 12% of the annual operating budget by the end of Phase One (Year 3). In order achieve this, we will need to be successful in earning the trust of a visionary group of 12-14 transformational donors in Tiers 1-4 (Table 4: Phase One Funding Campaign Tiers). Doing so, will allow PHIGS to allocate more of the budget for fundraising towards the promotion of our cause and the hosting of annual events targeting public awareness and community financial engagement beyond our Tier 1-4 donor base.
TABLE 3: Phase Two & Phase Three Forecasts
| Annual Operating Projection | GIRLS MIN | GIRLS MAX | HOMES (TOTAL) |
| PHASE TWO | $1,081,017 | $1,297,221 | 6 |
| PHASE THREE | $1,297,221 | $1,729,628 | 8 |
| Inflation Rate | 2.30% |

Master-Planning & Development Milestones
TABLE 4: Phase One Total Funding Campaign Tiers
| Funding Campaign Tiers | YR1 2026 | YR 2 2027 | YR 3 2028 | PHASE ONE |
| Tier 1 (1) @ 20% | $316,673 | $329,061 | $386,343 | $1,032,076 |
| Tier 2 (2) @ 10% | $158,337 | $164,530 | $193,171 | $516,038 |
| Tier 3 (4) @ 5% | $79,168 | $82,265 | $96,586 | $258,019 |
| Tier 4 (5) @ 2% | $31,667 | $32,906 | $38,634 | $103,208 |
| Tiers 1-4 Targets | $1,108,356 | $1,151,712 | $1,352,199 | $3,612,267 |
| Annual Event Goals | $475,010 | $493,591 | $579,514 | $1,548,114 |
- Licensing Actions and Processes
- Governance and Administration Responsibilities
- Financial and Operational Procedures
- Personnel Policies and Deployment
- Admission and Discharge Procedures
- Program Policies and Health Services
- Residential Code Requirements (Design, Construction, and Maintenance)
For good measure, this proforma is also the product of an 8-month feasibility review by the PHIGS' co-founders and their advisory committee from January 2024 to August 2024 (see About Us). Additionally, since late 2023, PHIGS has benefitted from consultation and training via Planting Oaks Network in developing our approach to wrap-around services and family-based care via our 9-Point Model (Chart 1 below). Finally, Chart 2, below, gives a good concluding snapshot for how the forecasted Phase One operating costs are to be distributed by Year 3.
CHART 1: 9-Point Guardianship Model
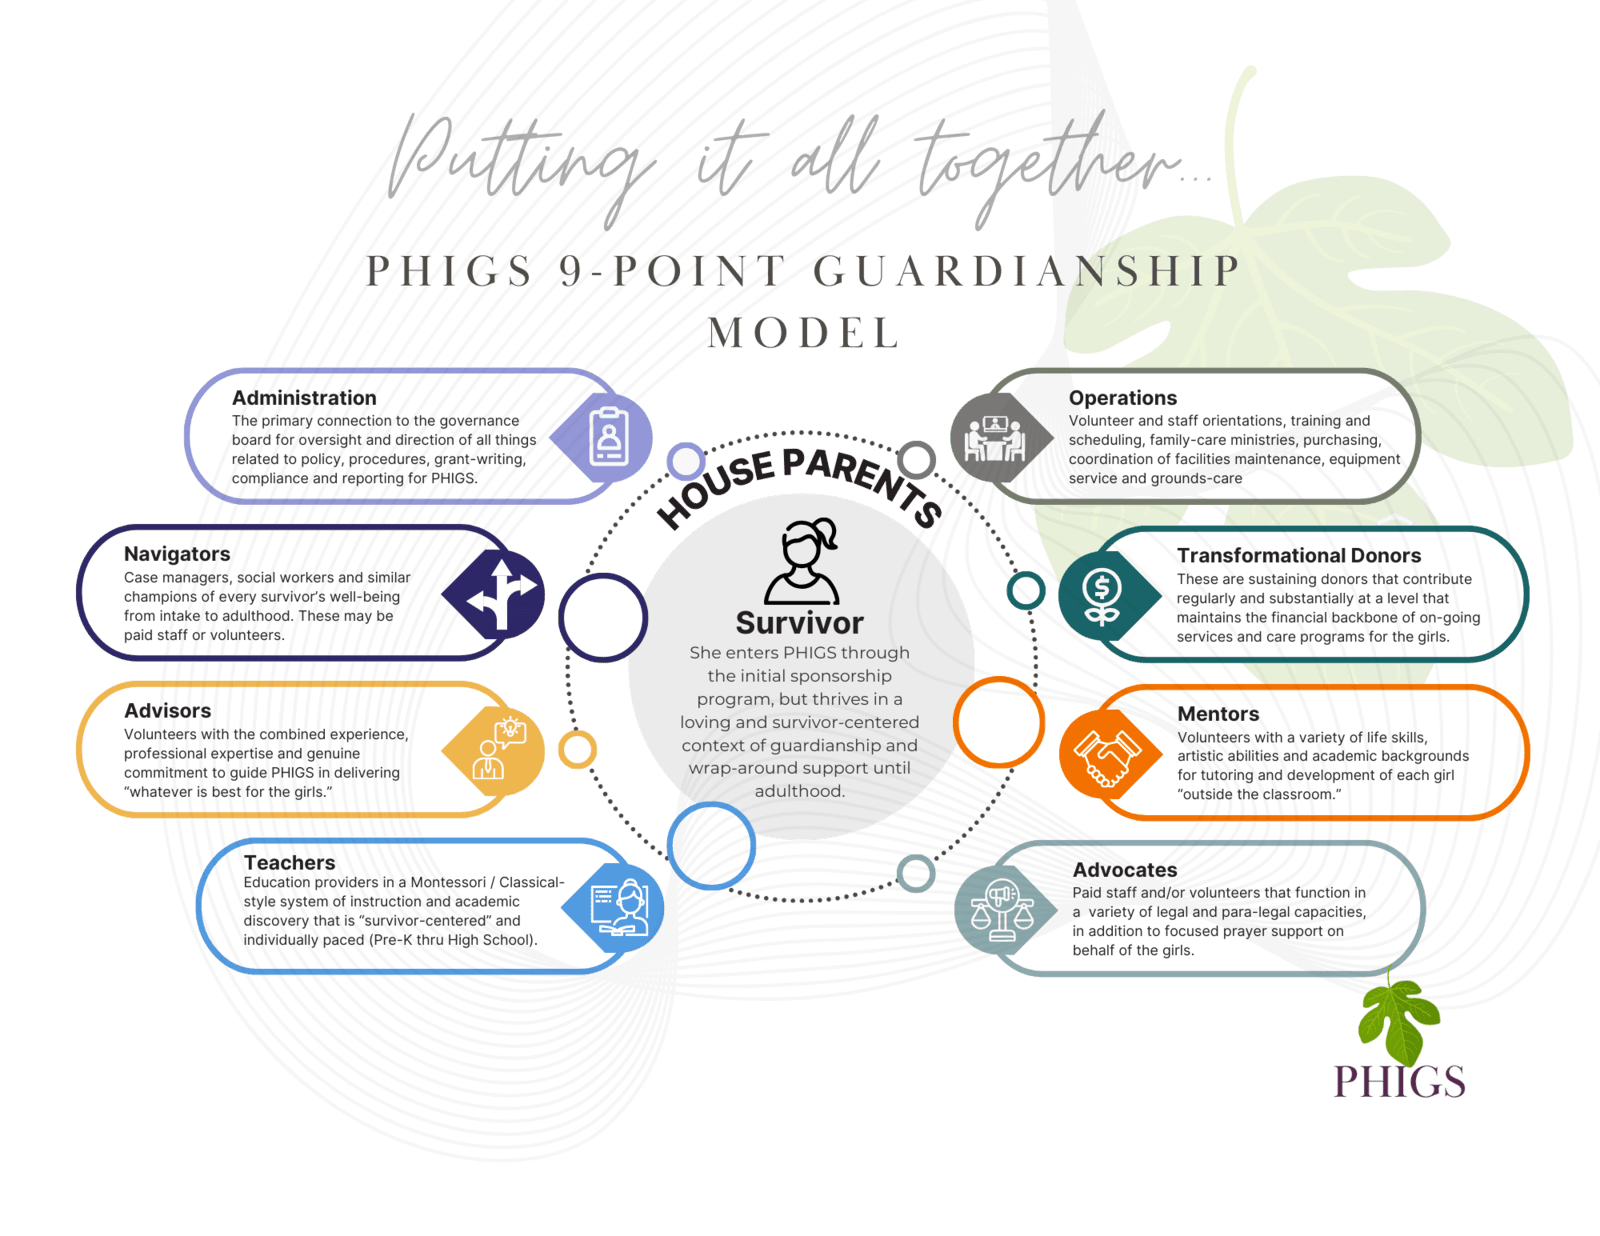
CHART 2: Year 3 Operating Summary